File:FRB Dallas - Income Increases to 2022.png: Difference between revisions
From Rest of What I Know
No edit summary |
(No difference)
|
Latest revision as of 06:53, 22 November 2025
A chart depicting the increase in income among various quintiles of the US population. It shows that the poorest had the biggest increases in income.
File history
Click on a date/time to view the file as it appeared at that time.
| Date/Time | Thumbnail | Dimensions | User | Comment | |
|---|---|---|---|---|---|
| current | 06:53, 22 November 2025 | 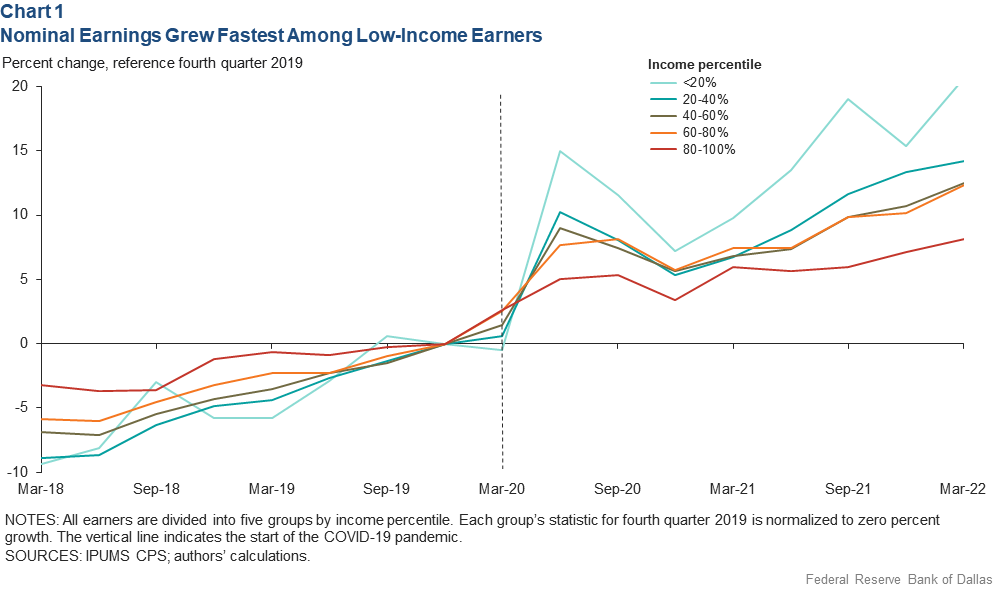 | 997 × 589 (48 KB) | Roshan (talk | contribs) |
You cannot overwrite this file.
File usage
The following page uses this file: